
Turning HubSpot Data into a Live Sales Performance Dashboard
- Client
- Northpoint Solutions (name changed)
- Industry
- Engineering Firm
- Location
- California
- What we built
- A customizable reporting dashboard connected to the client's HubSpot CRM
The Situation
Northpoint's customer success managers (CSMs) handle client meetings, new deals, and upsells, and every one of those activities is logged in HubSpot, their CRM. The data was all there, but it wasn't easy to use.
To see how the team was doing, someone had to export reports from HubSpot, paste them into spreadsheets, and calculate totals by hand. By the time a report was ready, the numbers were already out of date.
The Problem
Leadership couldn't answer simple questions quickly. Who closed the most deals this month? How much revenue did each person bring in? Which meetings were missed or cancelled? Which deals have gone quiet and need a follow-up?
HubSpot does come with built-in dashboards, but like most CRMs, they only go so deep. They show a fixed set of reports at a fixed level of detail, and the team couldn't easily drill down into the specific numbers they cared about or combine data the way they needed.
Answering these questions meant digging through HubSpot screens or waiting for a manual report. Problems like stalled deals or a pile of missed meetings were often noticed late, when they were harder to fix.
What We Built
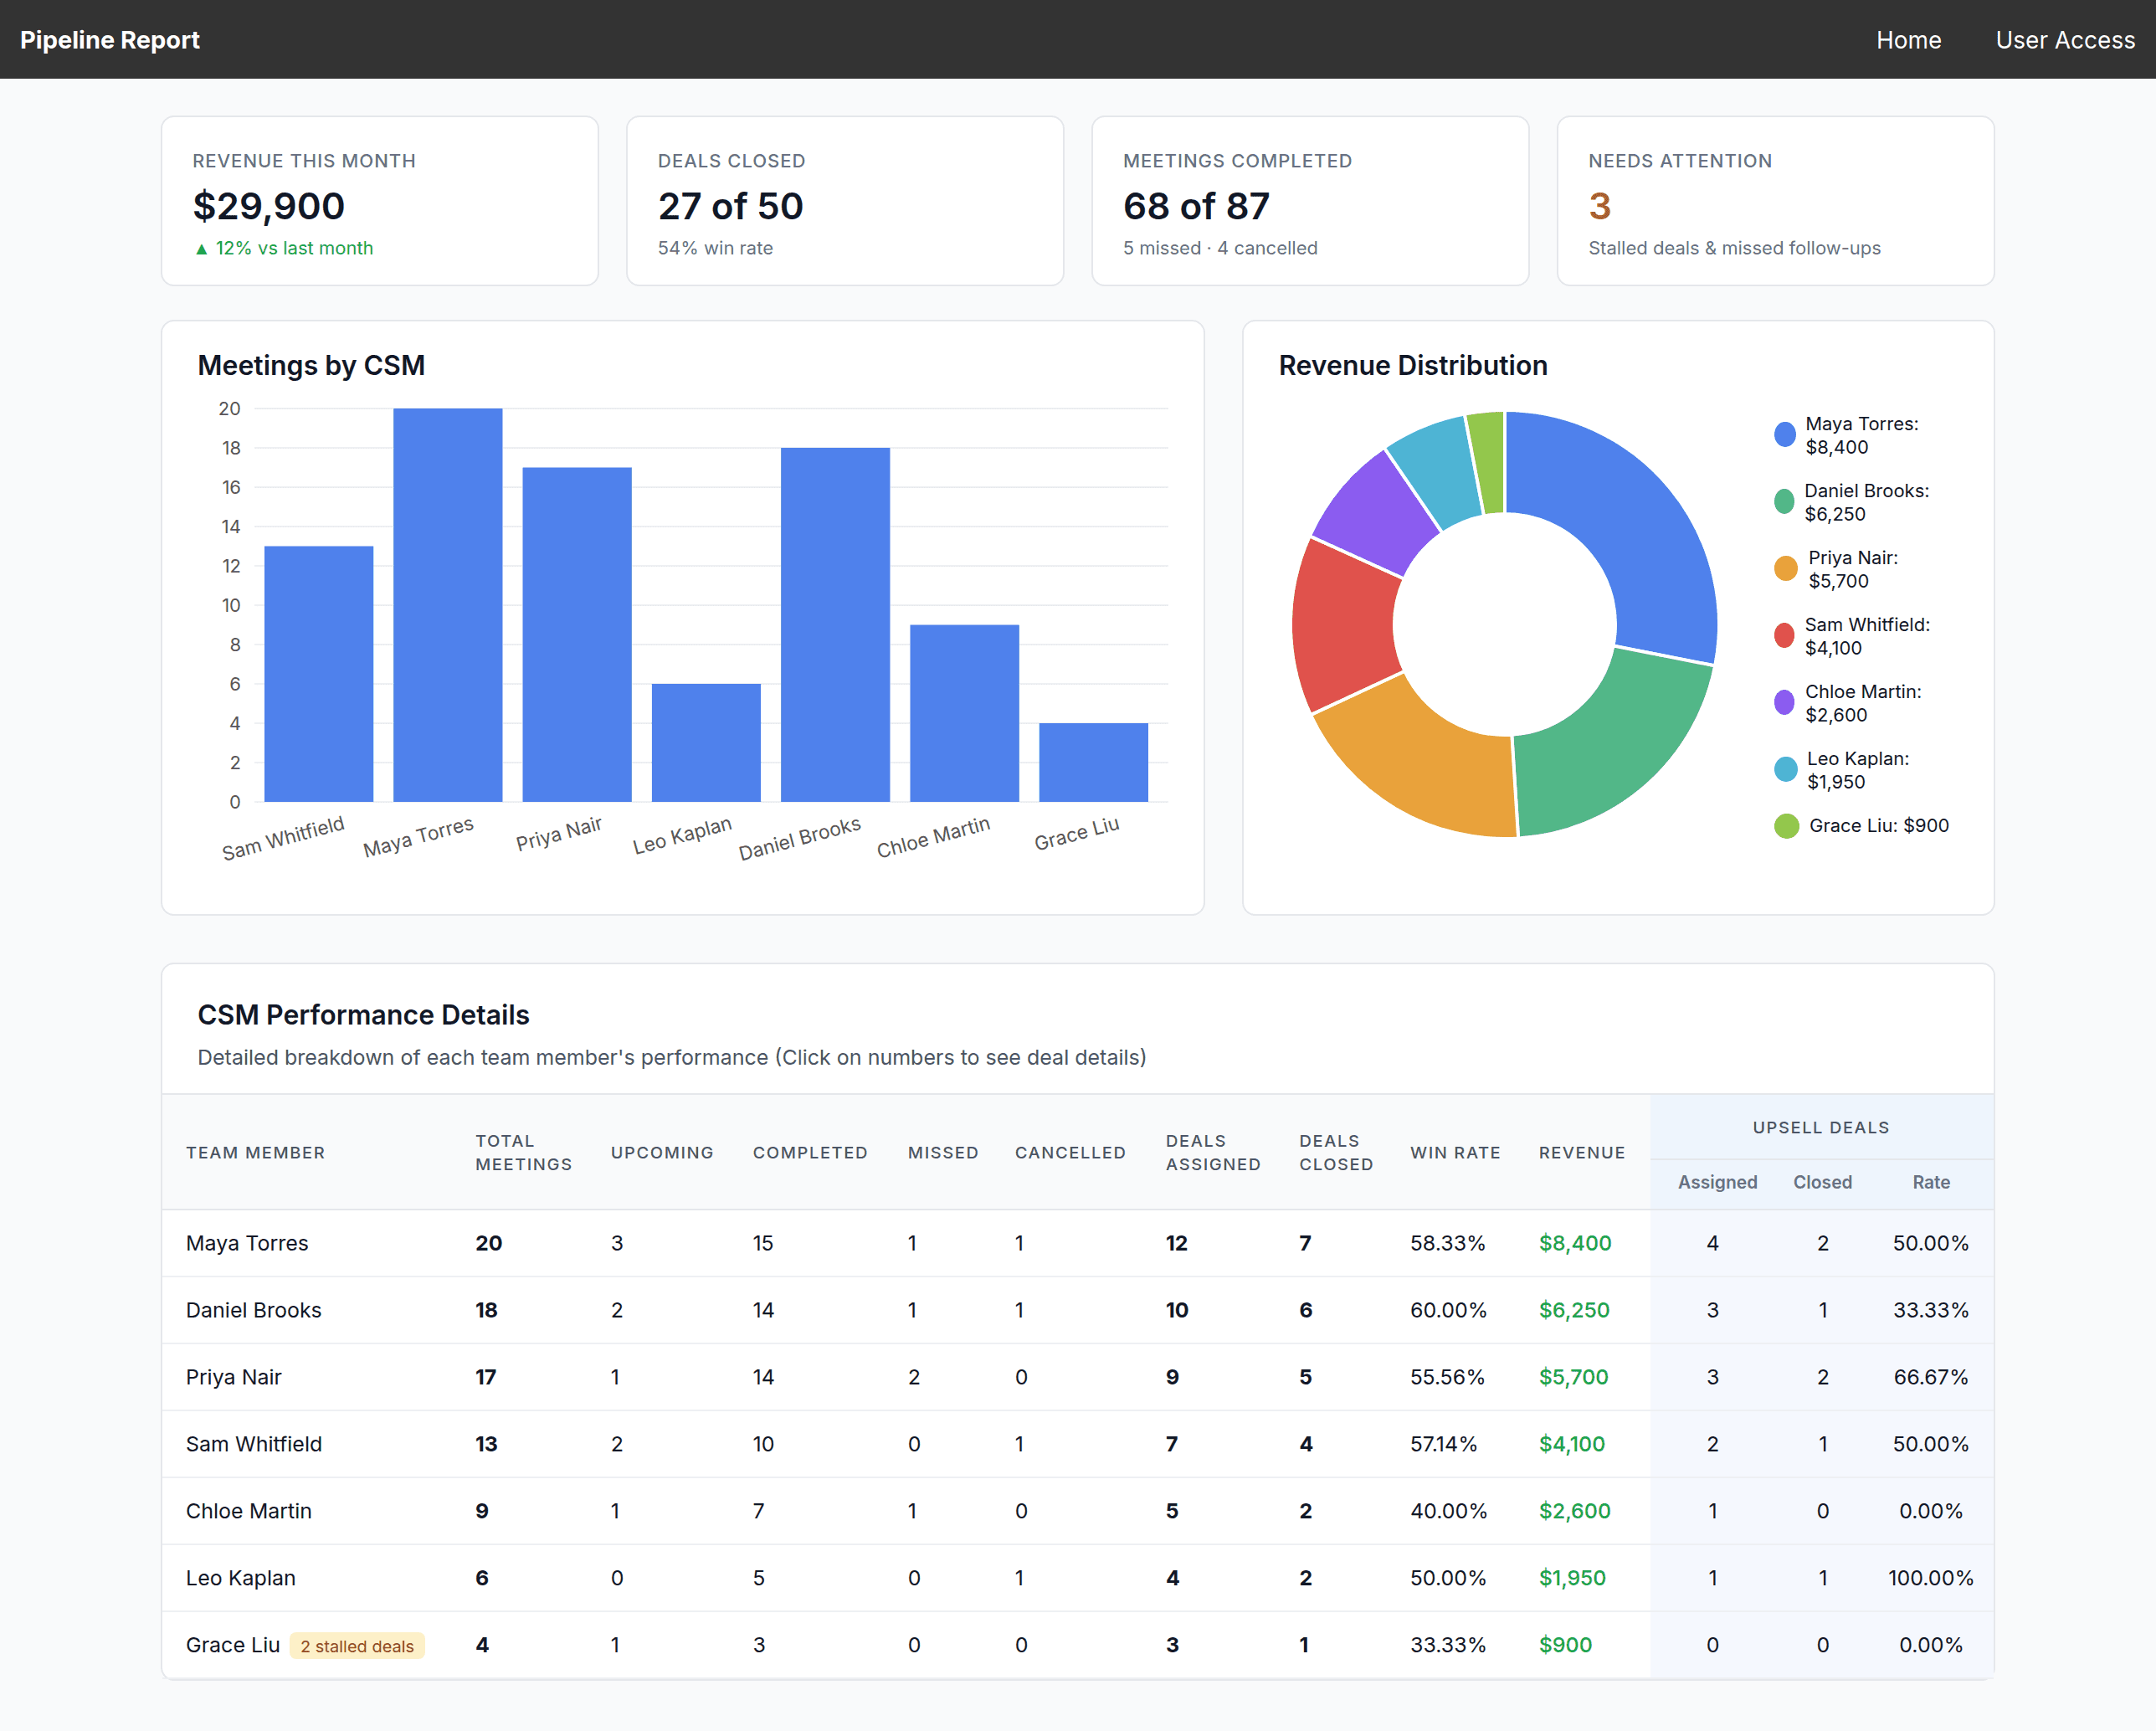
We built a dashboard that connects directly to HubSpot and turns the team's CRM data into clear, easy-to-read reports. Nobody has to export or copy anything: the dashboard pulls the latest data on its own.
Customizable to the level of detail they need
Unlike the default dashboards built into CRMs, which only show a set level of data, this dashboard is built around what Northpoint wants to see. Leadership can stay at the high level, while managers can drill down into each person, each deal, and each meeting. Views, metrics, and filters can be adjusted as their needs change.
Headline numbers at a glance
The top of the dashboard shows total revenue, deals closed, win rate, and meetings completed for the period, so leadership sees the big picture in seconds.
Performance for every team member
A detailed table breaks down each CSM's meetings (upcoming, completed, missed, and cancelled), deals assigned and closed, win rate, and revenue. Clicking a number opens the deals behind it.
Upsell tracking
Upsell deals are tracked separately, so the team can see how well they're growing existing accounts, not just winning new ones.
Visual charts
A meetings chart shows activity by person, and a revenue chart shows how each team member contributes to the total.
Items that need attention
The dashboard flags things that need action, such as stalled deals and missed follow-ups, so they get handled before they turn into lost revenue.
Access control
A User Access page lets admins decide who can view the dashboard.
The Results
What changed for the team:
- Reports that used to take hours of exporting and spreadsheet work are now available instantly.
- Leadership uses one shared, always-current view of the team's performance in meetings and planning.
- Managers can spot stalled deals and missed meetings early and step in sooner.
- Each CSM can see their own numbers, which makes goals and coaching conversations clearer and fairer.
- Decisions about workload, targets, and where to focus are now based on live data instead of guesswork.
The Takeaway
Most teams already have the data they need sitting in their CRM. The challenge is getting it out in a form people can actually use, at the level of detail they actually need. Built-in CRM dashboards only show so much. By connecting a customizable, purpose-built dashboard to HubSpot, Northpoint turned scattered CRM records into a daily tool for tracking performance, catching problems early, and making better business decisions.
Client name, team member names, and all figures shown are illustrative and have been changed to protect client confidentiality.